


.jpg)
.png)


Introduction
Coronary artery calcium scoring (CACS) was first introduced in the early 1990s as a method for early coronary artery disease (CAD) detection. Since then, there have been significant advancements in CACS from a technological standpoint, but more importantly, continuing compilation of supportive data has led to more widespread use, but certainly not universal acceptance.
A strong argument can be made that CACS imaging adds the most incremental information regarding the prediction of a coronary events beyond basic clinical data such as age, gender, ethnicity, total cholesterol and LDL cholesterol, particularly in the asymptomatic intermediate-risk population. The expert consensus statement from the Society of Cardiovascular Computed Tomography (SCCT) considers CACS an appropriate option in individuals without clinical atherosclerotic cardiovascular disease (ASCVD) who are 40 to 75 years of age in the 5-20% 10-year ASCVD risk group and selectively in the < 5% group.1,2 From this consensus statement, a moderate-intensity statin is recommended for those with CACS of 1–99 if they are less than the 75th percentile (for comparable age, gender and race), a moderate-to-high intensity statin for those with CACS of 1–99 if they are greater than the 75th percentile and for those with CACS of 100–299, and a high-intensity statin for those with CACS greater than or equal to 300. Aspirin is recommended in patients with a CACS greater than 100.1 In contrast to the above, for the symptomatic patient, or the patient with established CAD, CACS offers considerably less impact and therefore most experts would recommend not using CACS in this setting.
Case Presentations
Consider a 73-year-old asymptomatic man with CACS of 133. What is the impact of the calcium score? Further, how would the same score impact a 40-year-old woman? How would a CACS of 133 be different in a 40-year-old man?
CAC Acquisition and Technology: Total Score versus Individual Coronary Artery Scores
Coronary calcium is defined in the Computed Tomography (CT) literature as a lesion above a threshold of 130 Hounsfield units with an area of at least 1 mm.2 Agatston et. al. developed the original calcium score which is determined by the product of the plaque area and maximum calcium lesion density.3 Calcium volume, independent of calcium density, is a more reproducible parameter and although it may be the parameter of choice for serial studies to track progression or regression, it is rarely used. CACS are typically reported by individual coronary arteries (that is LAD, RCA and Circumflex coronary arteries) and as the total calcium scores.
.png)
Figure 1 shows the 10-year predicted risk of coronary heart disease in individuals at intermediate Framingham risk and the relationship to coronary artery calcium scores. Coronary artery calcium scores above 615 Agatston units and below 50 Agatston units suggest reclassification to the higher or lower risk categories, respectively.6
The Power of CAC to Predict Coronary Events
Multiple studies have investigated the correlation between coronary events, atherosclerosis measures, and an absolute CACS. In a study by Villines et. al., a CACS of zero had a negative predictive value of 99% for greater than 70% stenosis.4 Lamonte et. al. showed that there is a direct association between CACS and incident CHD events in asymptomatic individuals and that the CACS was a significant predictor of all CHD events.5 Evaluating a subset of the population, the Rotterdam Study evaluated more than 2000 patients and found that reclassification of risk by CAC scoring was most substantial in individuals initially classified as intermediate risk based on the Framingham Risk score.6

Table 1 shows the age- and gender-adjusted risk of coronary heart disease events by level of coronary artery calcium and number of coronary heart disease risk factors in Dallas, Texas between 1995 and 2000. These risk factors included hypertension, hypercholesterolemia, diabetes, current smoker, and history of myocardial infarction or coronary heart disease.5
Population Differences: The Prognosis of a CACS of Zero
A CACS of zero does not mean absence of coronary artery disease or guarantee the lack of a coronary event. Rather, a CACS of zero signifies the absence of “hard” plaque, defined as plaque that contains calcium. Conversely, CACS does not exclude the presence of “soft plaque.”7 Further, exclusively uncalcified plaque is present in only 5% of acute ischemic syndromes across all age groups.1,8-11 Overall, the absence of calcified plaque conveys an extraordinarily low (1.1 to 1.7%) 10-year risk regardless of the presence of additional risk factors. Interestingly, compiled data in 44,052 asymptomatic patients with a 5.6 ± 2.6 year follow-up, the 5-year survival rate for those with a CACS of zero was 99.7% for those with no risk factors and only decreased nominally to 99.0% for those with greater than or equal to 3 risk factors.12 Looking at a compilation of studies, although having a CACS of zero does not portend immortality, the risk of a coronary event is very low, definable, and across the board of the multiple studies is roughly 0.1% per year. Framed another way, a CACS of zero is indicative of a 1% 10-year risk and a 99% chance of lack of a coronary event.2,4,13-15
Population Differences: CAC and Age
As noted above, a younger population tends to have a lower CACS compared to the older population regardless of gender differences. In the Coronary Artery Risk Development in Young Adults (CARDIA) study, CAC was more prevalent among men than women in the younger population they evaluated (ages 33-45 years old).16 A very small percentage of women (3%) had a CACS above zero at age 40. This is dramatically less compared to men (10%) at age 40. Moreover, a young patient with a CAC score greater than 100, or particularly greater than 300 is much more concerning than a 73-year-old individual with the same score. Risk categorization based on age and gender are available for most ethnicities (as detailed below). If the CACS puts the patient in a category where they are greater than the 75th percentile for comparable age, gender, and ethnicity, the odds ratio for a coronary event is particularly high and a recommendation for intervention with medical therapy should be highly considered.1
Population Differences: CAC and Gender
In reference to our case presentation, a study by Lamonte et. al. showed that women had a higher risk of coronary heart disease (CHD) events than men with the same CAC score.5 They went on to show that women are more likely to have a CHD event at a lower CAC score compared to men. Another study by Pletcher et. al. compares various patient scenarios and determines their risk. For example, an elderly man without risk factors has a pre-test risk of 10% based on his age alone. A CAC score in this patient of greater than 100 or even greater than 300 “is quite likely and not overly worrisome.” However, a woman who has a pre-test risk of 10% because of her ASCVD risk factors, a CAC score of greater than 100 would be rare and “alarmingly high.” 14 As depicted by figure 2 below (adapted from Pletcher, et. al.),14 men are more likely to develop CAC at a younger age than women. For example, there are more men in the 45 to 54 year old age group who are likely to have a CACS greater than 148 than women in the same age group.
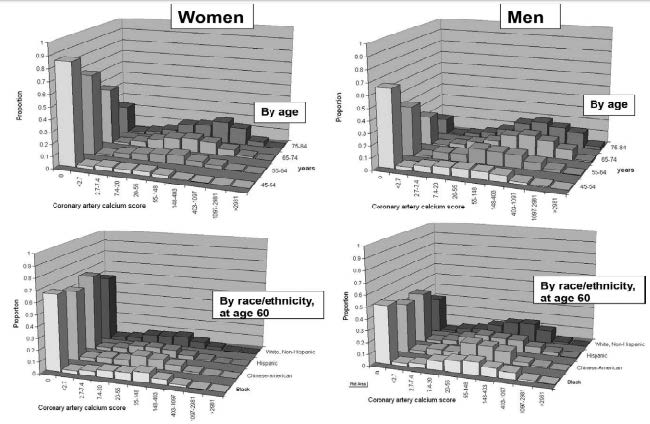
Figure 2 shows the distribution of coronary artery calcium (CAC) scores among women and men by age and race or ethnicity. The distributions of log-transformed CAC scores were approximately normal and the CAC scores correspond to Ln(CAC) scores of < 1, 1-2, 2-3, 3-4, 4-5, 5-6, 6-7, 7-8, and > 8. The first bar in each graph represents individuals with no detectable CAC (and an undefined Ln(CAC) value). Age, gender, and race or ethnicity are strong predictors of the presence and extent of CAC.14
Population Differences: CAC and Ethnicity
In addition to age and gender, ethnicity also plays a significant role in the interpretation of the risk of a given CACS. DeFilippis et. al. showed that the Framingham Risk Score and the Reynolds Risk performed equally across 4 race groups in predicting incident CAC, but predicted significantly greater CAC progression in whites as compared to Chinese, African Americans, or Hispanics.17 In another study, the survival over a ten-year period based on ethnicity as an independent predictor of mortality was 96%, 93%, and 92% for Asians, non-Hispanic whites, and Hispanics, respectively, as compared with 83% for African Americans (p < 0.0001). When comparing prognosis by CACS in ethnic minorities as compared with non-Hispanic whites, relative risk ratios for all-cause mortality were highest for African Americans with CACS greater than or equal to 400 exceeding 16.1 (p < 0.0001). Hispanics with CACS greater than or equal to 400 had relative risk ratios from 7.9 to 9.0, whereas Asians with CACS greater than or equal to 1,000 had relative risk ratios 6.6-fold higher than non-Hispanic whites (with similar CACS) (p < 0.0001).18 Additionally, the Multi-Ethnic Study of Atherosclerosis (MESA) study showed that the highest prevalence of CAC was seen in the non-Hispanic white participants.14,19 Similarly, a study by Bild et. al. found that the prevalence of CAC was 22%,15%, and 8% lower in blacks, Hispanics, and Chinese, respectively, compared to whites.15,19 In the CARDIA study, CAC was more prevalent in the white compared to African American populations, despite general findings of higher CHD morbidity and mortality among African Americans.16 These studies suggest that the black population is less likely to have elevated CAC scores, but if they do, they are at higher risk compared to the white population. They also suggest that in the younger population (33-45 years old), CACS may be less reliable as an indicator of CHD risk in the African American population.

Figure 3 shows the survival ranges for various ethnic groups. Using risk-stratified Cox proportional hazard survival analyses, survival for non-Hispanic whites ranged from 98% to 57% for CACS of 0 to 10 to greater than or equal to 1,000. Survival ranged from 97% to 30% in African Americans, 99% to 60% in Hispanics, and 100% to 80% in Asians for CACS of 0 to 10 to greater than or equal to 1,000. Using this model, CACS remained predictive of death in a model controlling for age and risk factors in all ethnic subsets (p < 0.0001). For subset multivariable models, CACS was predictive of death for non-Hispanic whites (p < 0.0001), Hispanics (p < 0.0001), African Americans (p < 0.0001), and for Asians (p < 0.002), respectively. In addition, in a stepwise model, the CACS was identified as the single greatest estimator of time to mortality for each ethnic subset.18
CAC and Cardiovascular Risk
The ultimate question is whether CACS can be used to define cardiovascular risk. A study evaluating CACS as a predictor of coronary events found that the adjusted risk of a coronary event was increased by a factor of 7.7 among participants with CACS between 101 and 300 and by a factor of 9.7 among participants with scores above 300 when compared to individuals with no coronary calcium (p < 0.001 for both comparisons).20 A study by Pletcher et. al. suggests that a given CAC score may be either higher or lower than expected, and the risk estimate should logically shift higher or lower accordingly. The authors go on to state that the CAC score should be combined with the patient’s risk factors to determine an individual’s shift from pre-test to post-test risk for CHD.14 Compared with a CACS of zero, a patient with a CACS of greater than 300 carried a significantly higher risk of MI or CHD death (p < 0.001). A statistically significant difference in cardiovascular outcomes was also noted between a CACS of greater than 300 compared to a CACS of 1-100 and 101-300 for patients with a Framingham Risk Score of 10% or more (p < 0.001). Finally, in patients with a Framingham Risk Score of less than 10%, a CACS of greater than 300 had a significant difference in cardiovascular outcomes when compared to patients with a CACS of zero (p = 0.01).13 Based on these studies, the NLA recommendations include that a CACS of greater than or equal to 300 Agatston units is considered an indication of high risk and should encourage optimal statin intensity and goal attainment.21
The Utility of Serial CAC scans
The use of serial CAC scanning in patients has been more controversial than the general utility of CAC scoring. In the past, questions were raised regarding whether increasing CACS were worrisome, especially when patients were placed on statin therapy. One argument was that progression of CACS was anticipated and meant only that soft plaque was being stabilized into a less lipid-rich plaque with more calcium. However, several studies have shown that individuals who have progressively increasing CACS have a worse prognosis. The MESA study shows that patients who have greater than 15% progression of CACS compared to those who have less than 15% progression,19,20,22 have a higher event rate. Another consideration is that in those individuals who have an increase of greater than 300 Agatston units on serial CAC scans have a particularly poor prognosis.23,24 Finally, statins have little impact on the progression of calcium. In fact, the rate of calcium progression was essentially equal in 5 randomized trials of statin versus placebo.25,26
Clinical Utility of CAC Compared to CT Coronary Angiography
Another computed tomographic imaging modality that is currently utilized for the evaluation of coronary artery disease (CAD) is coronary computed tomographic angiography (CCTA).27 Though both quantification of CAC and CCTA utilize a multi-slice computerized tomographic scanner, there are inherent differences between the two imaging techniques.28,29 Quantification of CAC aids clinicians in determining a patient’s risk of CAD but is unable to determine if a patient has coronary artery obstruction.1 CCTA, however, can directly visualize the lumen of blood vessels, determine composition of most plaques, and determine whether areas of coronary artery plaque are obstructive (defined as greater than 50% luminal narrowing).14,30 Both modalities have a high negative predictive value for coronary events. In one study, patients with absence of CAD on CCTA had no cardiac events in a 12 to 21-month follow-up period.27 In addition, a study of 230 patients without known CAD showed a negative predictive value of 99% for detecting lesions of greater than 50% when compared to invasive angiography.31 Patients with a CACS of zero may still have CAD detected by CCTA. In two studies comparing CACS quantification directly to CCTA, 4-7% of patients with a CACS of zero had evidence of coronary artery plaque by CCTA. 27,29 Also, patients with higher CACS have a higher likelihood of having an obstructive lesion on CCTA. In two comparative studies, 16-22% of patients with CAC scores of greater than 400 had an obstructive lesion on CCTA compared to 4-11% of patients with CACS between 10 and 399.27,29 In addition, only 1-2.8% of patients with a CACS of zero had an obstructive lesion by CCTA.
However, CCTA has limitations. Firstly, a CCTA study exposes the patients to higher doses of radiation than CAC scoring and thus carries a higher potential risk of malignancy.27,28,32 As CT technology improves however, the amount of radiation exposure has diminished. Another limitation of CCTA is that high calcium burden may make interpretation of luminal narrowing difficult due to artifact from the calcium. When compared to invasive angiography, patients with CACS above 400 had an overall specificity of detecting significant stenoses in 34% of cases and the specificity decreased to 9.1% if CACS was above 1000.33 Finally, in studies where CCTA was employed for screening in asymptomatic patients, roughly 5-8% of patients had obstructive coronary artery disease. Currently, significant CAD detected on CCTA in asymptomatic patients is of unclear clinical significance and it is also unclear whether these patients warrant further care beyond optimal medical management.27,29 Current appropriateness guidelines recommend use of CCTA in evaluating patients with low to intermediate risk of CAD who present with anginal symptoms. In addition, for individuals with a calcium score greater than or equal to 600, a CTA is less effective with an area under the curve that decreased from 0.93 to 0.81 when CACS were higher than 600.34 There are no current recommended guidelines for the use of CCTA in asymptomatic patients without known CAD, so we conclude that CACS is a more appropriate screening tool.35
Discussion
Coronary calcium scoring (CACS), first introduced in 1990, has since undergone technologic improvements and some expansion of its utilization for the risk stratification of ASCVD. CACS arguably provides the most incremental information beyond traditional clinical risk factors in the intermediate risk population.1 The MESA trial was a landmark validation of CACS demonstrating superiority over carotid intimal medial thickness.17 Patient characteristics, including age, gender, and ethnicity impact the interpretation of a CACS.5,14,18 Per our case presentations, a non-zero CACS in a 40-year old, non-white woman would carry far greater significance than a similar CACS in a 73-year-old white man.5,18 Though a CACS of zero does not imply the absence of plaque, as it cannot detect non-calcified plaque, such a score does carry a negative predictive value of 99% for obstructions of greater than 70% and carries an extraordinarily low 10-year risk of coronary events.4,36 Currently, NLA recommendations employ an absolute CACS cutoff of 300 to indicate high risk for coronary events but CACS should be tailored to each individual to determine their overall long-term risk.14,21 A major limitation of CACS is the inability to detect non-calcified plaque which may be present in 4-7% of patients with a CACS of zero and its inability to detect obstructive stenoses.27,29 In these cases, other imaging techniques and studies can be employed to further investigate an individual’s risk. Current guidelines recommend consideration of CACS for patients between age 40 and 75 with a 5-20% 10- year ASCVD risk and selectively in patients below a 5% 10-year risk.1
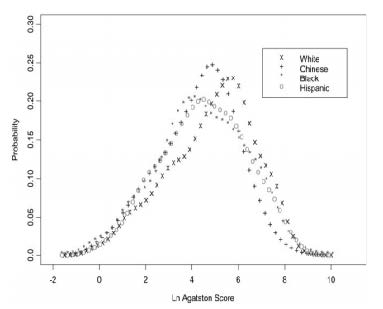
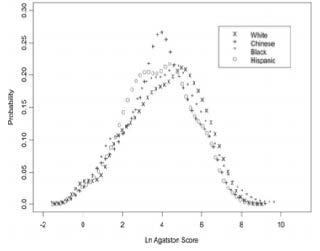
Figure 4 shows the distribution of CACS among men (left panel) and women (right panel) with detectable calcification. There is a shift to the right among white individuals relative to the other ethnic groups, which indicates generally higher scores in whites. Similarly, white individuals had the highest prevalence (44.6%), followed by Chinese (41.9%), black (36.5%), and Hispanic individuals (34.9%). These findings are similar between men and women.19
Summary: Our Recommendations
1. CACS should be expanded to evaluate asymptomatic individuals who have an intermediate ASCVD risk by the Framingham risk score, since the CACS adds discriminate power over the risk score alone
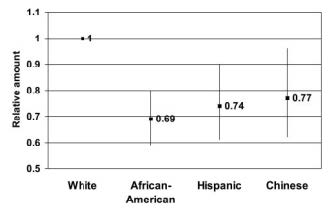
Figure 5 shows relative coronary calcium amount (in Agatston units) by ethnicity compared with white, among those with detectable calcification. 95% confidence intervals shown, adjusted for age, gender, education, body mass index, LCL cholesterol, triglycerides, smoking, hypertension, diabetes, reported treatment for high cholesterol, and center. After adjustment for the above factors, CACS relative to whites were lower in blacks (69% that of whites, 95% CI 59% to 80%), Hispanics (74% that of whites, 95% CI 61% to 90%), and Chinese (77% that of whites, 95% CI 62% to 96%).19
2. Age, gender, and ethnicity are important factors to consider when interpreting a CACS and the interpretation thus should be individualized to maximize the accuracy of ASCVD risk
3. CACS of greater than 300 should be considered the equivalent of coronary artery disease, particularly in patients otherwise felt to have low to intermediate ASCVD risk
a. Such patients should be counseled on the benefits of high-intensity statin therapy
b. The LDL goal for such patients is likely to be re-addressed in the next ACC/AHA update on lipid guidelines and cardiac prevention
4.CCTA use is recommended in patients with low to intermediate risk of CAD who present with symptoms concerning for angina. Otherwise, CCTA has no role in asymptomatic patients or those with known CAD
a. Patients with a particularly high CACS, probably above 600, but definitely above 1000, should not undergo CCTA because of the high likelihood of a non-diagnostic scan due to interference from the presence of calcium
b. The actual cutoff for avoiding CCTA in patients with high CACS also must be individualized, taking into account whether the calcifications are diffuse or localized to a single coronary artery and whether there is involvement of the left main or left anterior descending arteries.
Disclosure statement: All authors of this article have no financial disclosures to report.
References available here.
Article By:

Fellow in Cardiovascular Medicine
University of Colorado

Fellow - Cardiovascular Disease
University of Colorado

Director of Interventional Echocardiography
Professor of Medicine
Division of Cardiology
University of Colorado School of Medicine, Anschutz
Diplomate, American Board of Clinical Lipidology